NZ Poll of Polls 2026
Poll aggregation and seat forecast for the New Zealand general election on 7 November 2026
39 days to go. 119 polls this term from 7 pollsters; the latest was taken 25 September 2026. Updated 29 September 2026.
Election-day forecast
46%
National + ACT + NZ First majority
61 seats (52–69)
<1%
National + ACT majority
47 seats (40–54)
1%
National + NZ First majority
48 seats (40–56)
8%
National + ACT + TOP majority
54 seats (45–62)
8%
Labour + Green + Te Pāti Māori majority
54 seats (45–63)
2%
Labour + Green majority
50 seats (41–59)
66%
Labour + Green + NZ First majority
63 seats (55–72)
18%
Labour + Green + TOP majority
56 seats (48–65)
45%
Labour + Green + Te Pāti Māori + TOP majority
60 seats (51–69)
Who holds the balance of power
The chance of each outcome on election day. A pivot party’s column is the chance that it alone would give the bloc a majority; when either would, both columns count it.
| Bloc | Majority alone | Enough with NZ First | Enough with TOP | Needs NZ First and TOP | Short even then |
|---|---|---|---|---|---|
| Right bloc (National, ACT) | <1% | 46% | 8% | 39% | 11% |
| Left bloc (Labour, Green, Te Pāti Māori) | 8% | 80% | 37% | 8% | <1% |
Expected House size 121.4 seats (chance of an overhang 68%).
Parties
| Party | Now | Election day | 90% interval | P(≥ 5%) | Seats (mean) | Seats 90% |
|---|---|---|---|---|---|---|
| National | 28.2% | 27.8% | 22.5–33.4% | >99% | 34.4 | 28–42 |
| Labour | 27.8% | 27.7% | 20.6–35.4% | >99% | 34.2 | 25–44 |
| Green | 12.6% | 12.5% | 9.5–16.0% | >99% | 15.4 | 12–20 |
| ACT | 10.2% | 10.3% | 6.4–15.4% | 99% | 12.7 | 8–19 |
| NZ First | 10.9% | 11.0% | 7.2–15.7% | >99% | 13.5 | 9–19 |
| Te Pāti Māori | 2.0% | 2.0% | 1.1–3.3% | <1% | 3.9 | 2–6 |
| TOP | 6.4% | 6.7% | 3.0–12.0% | 71% | 6.8 | 0–15 |
| Other | 1.9% | 2.0% | 0.8–3.9% | 1% | 0.0 | 0–0 |
Voting intention
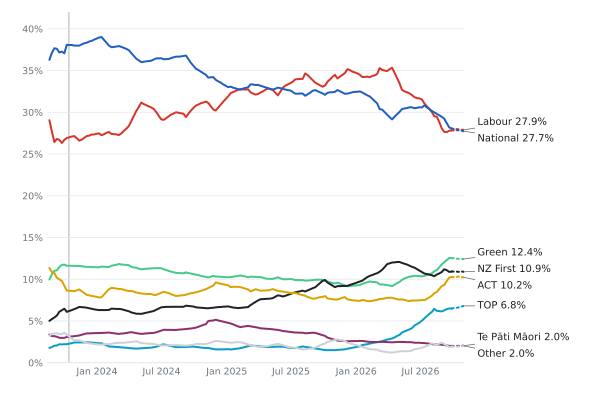
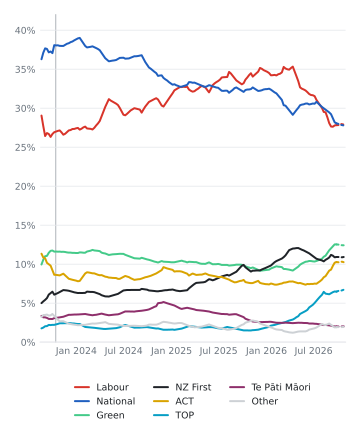
All parties
Estimated support for every party on one scale. Hover to read every party in a week; click a party in the legend to hide it, or double-click to show it alone. The dotted section is the projection to election day. The numbers are in trend.csv.
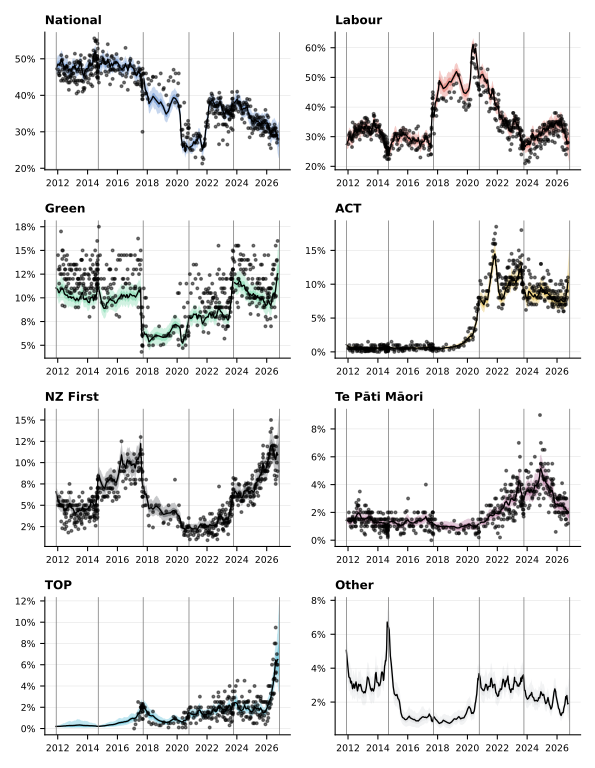
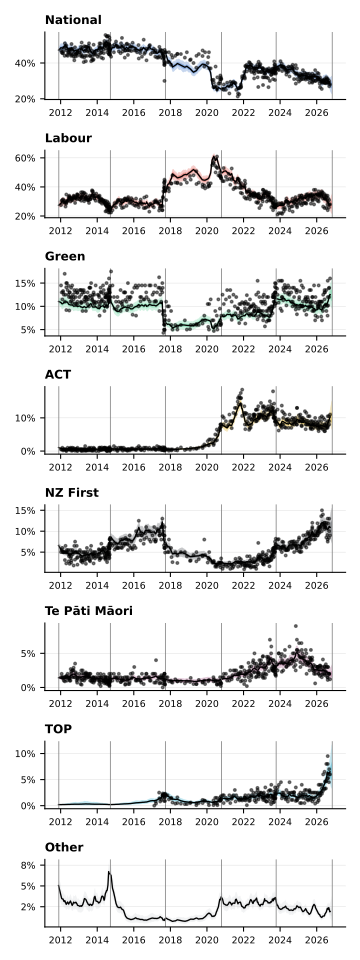
Each party, with its polls
Points are individual polls. The line is the model’s estimate of underlying support after removing house effects, and the bands are 50% and 90% credible intervals.
Seats
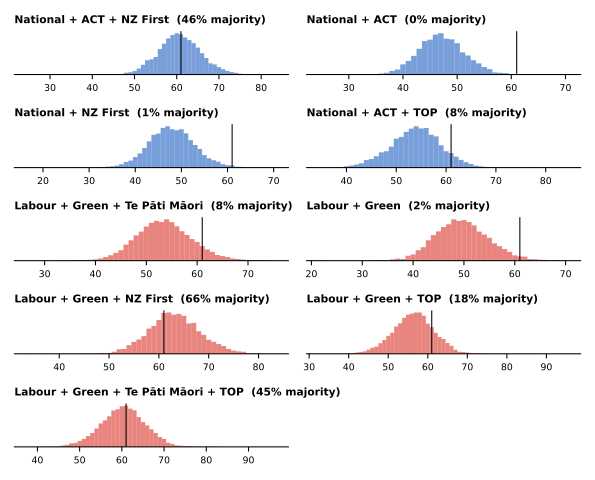
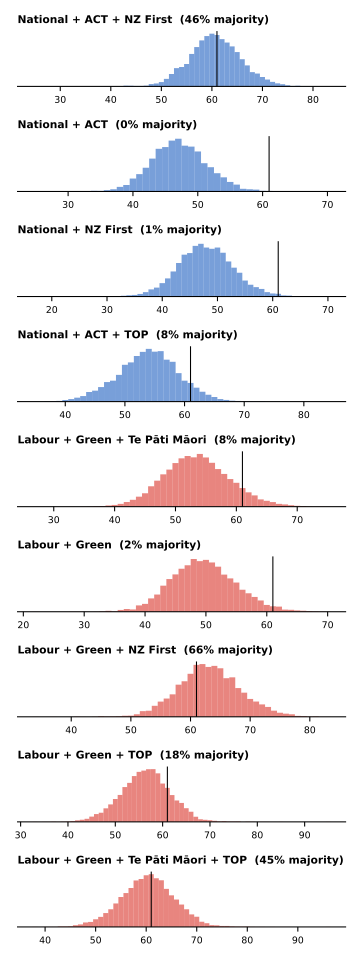
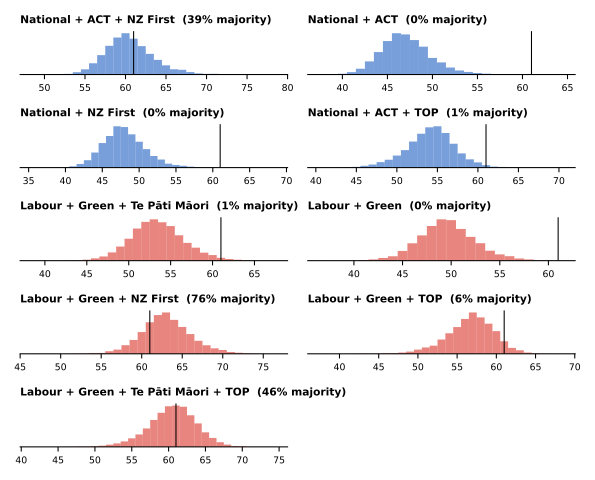
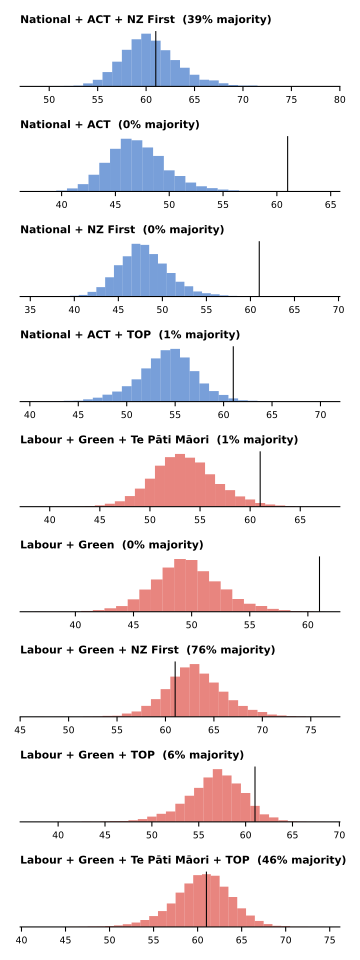
The chance of each number of seats for each coalition, from 20,000 simulated elections. The vertical line is a majority.
| Coalition | Now: majority | Now: seats | Election day: majority | Election day: seats |
|---|---|---|---|---|
| National + ACT + NZ First | 39% | 60 | 46% | 61 (52–69) |
| National + ACT | <1% | 47 | <1% | 47 (40–54) |
| National + NZ First | <1% | 48 | 1% | 48 (40–56) |
| National + ACT + TOP | 1% | 54 | 8% | 54 (45–62) |
| Labour + Green + Te Pāti Māori | 1% | 53 | 8% | 54 (45–63) |
| Labour + Green | <1% | 50 | 2% | 50 (41–59) |
| Labour + Green + NZ First | 76% | 63 | 66% | 63 (55–72) |
| Labour + Green + TOP | 6% | 57 | 18% | 56 (48–65) |
| Labour + Green + Te Pāti Māori + TOP | 46% | 61 | 45% | 60 (51–69) |
Electorate seats for parties under the 5% threshold (ACT in Epsom, Te Pāti Māori in the Māori electorates, and independents) are simulated from editorial assumptions in config/electorates.yml, not from polls.
House effects
The average difference between each pollster’s published numbers and the model’s estimate of true support, in percentage points, at current support levels. Positive means the pollster tends to report a higher number.
How well has the model done in the past?
Each model was refitted using only the polls published 26, 8, 4 and 1 weeks before the 2017, 2020 and 2023 elections, and scored against the result. CRPS is the average error of the whole forecast distribution in percentage points; lower is better. The 90% coverage should be close to 0.9. How the model is tested.
| Model | CRPS (pp) | Mean abs. error (pp) | 90% coverage | 50% coverage | Brier (bloc lead) | Cases |
|---|---|---|---|---|---|---|
| Stacked ensemble (out of sample) | 1.60 | 2.29 | 0.87 | 0.47 | 0.123 | 12 |
| Stacked ensemble + spread calibration (out of sample) | 1.60 | 2.31 | 0.84 | 0.46 | 0.126 | 12 |
| Equal-weight ensemble | 1.67 | 2.36 | 0.87 | 0.46 | 0.123 | 12 |
| Gaussian, heavy-tailed shocks | 1.60 | 2.28 | 0.86 | 0.41 | 0.111 | 12 |
| Gaussian | 1.58 | 2.27 | 0.89 | 0.47 | 0.123 | 12 |
| Dirichlet-multinomial | 1.90 | 2.60 | 0.82 | 0.42 | 0.150 | 12 |
| 2023 model (replica) | 1.97 | 2.47 | 0.55 | 0.18 | 0.041 | 12 |
CRPS by weeks before the election, with 90% coverage in brackets:
| Model | 26 weeks | 8 weeks | 4 weeks | 1 week |
|---|---|---|---|---|
| Stacked ensemble (out of sample) | 2.74 (0.69) | 1.75 (0.85) | 1.04 (1.00) | 0.87 (0.93) |
| Stacked ensemble + spread calibration (out of sample) | 2.68 (0.85) | 1.77 (0.81) | 1.06 (0.96) | 0.89 (0.73) |
| Equal-weight ensemble | 2.94 (0.69) | 1.78 (0.85) | 1.07 (1.00) | 0.89 (0.93) |
| Gaussian, heavy-tailed shocks | 2.77 (0.65) | 1.78 (0.85) | 1.01 (1.00) | 0.83 (0.93) |
| Gaussian | 2.69 (0.69) | 1.72 (0.85) | 1.04 (1.00) | 0.86 (1.00) |
| Dirichlet-multinomial | 3.47 (0.63) | 1.83 (0.81) | 1.19 (0.96) | 1.11 (0.87) |
| 2023 model (replica) | 3.22 (0.58) | 2.05 (0.51) | 1.41 (0.63) | 1.19 (0.49) |
The published ensemble beat the 2023 model on CRPS in 9 of 12 backtest cases. Stacking weights for 2026, fitted on 12 backtest cases: Gaussian 0.60, Gaussian, heavy-tailed shocks 0.40.
Recent polls
| Field dates | Pollster | n | National | Labour | Green | ACT | NZ First | Te Pāti Māori | TOP |
|---|---|---|---|---|---|---|---|---|---|
| 23–27 Sep 2026 | Verian | 1004 | 28.0 | 28.0 | 16.0 | 11.0 | 9.0 | 1.2 | 6.0 |
| 4–10 Sep 2026 | Anacta | 1701 | 30.0 | 31.0 | 12.0 | 8.0 | 10.0 | 2.0 | 7.0 |
| 4–11 Sep 2026 | Freshwater Strategy | 1011 | 27.0 | 28.0 | 14.0 | 9.0 | 13.0 | 2.0 | 6.0 |
| 1–3 Sep 2026 | Curia | 1000 | 29.0 | 25.9 | 13.9 | 10.5 | 8.4 | 2.0 | 4.5 |
| 14–21 Aug 2026 | Reid Research | 1000 | 29.1 | 32.2 | 10.2 | 7.7 | 11.9 | 3.0 | 5.3 |
| 27 Jul – 23 Aug 2026 | Roy Morgan | 858 | 31.0 | 24.0 | 15.5 | 10.5 | 7.5 | 1.5 | 9.5 |
| 8–11 Aug 2026 | Verian | 847 | 29.0 | 30.0 | 12.0 | 9.0 | 8.0 | 1.1 | 8.0 |
| 1–11 Aug 2026 | Talbot Mills | 1000 | 29.0 | 34.0 | 8.0 | 7.0 | 13.0 | 3.0 | 5.2 |
| 1–4 Aug 2026 | Curia | 1000 | 31.0 | 27.8 | 10.1 | 7.3 | 9.1 | 1.5 | 6.1 |
| 10–19 Jul 2026 | Talbot Mills | 1000 | 31.0 | 33.0 | 9.0 | 7.0 | 12.0 | 3.0 | 4.7 |
| 29 Jun – 26 Jul 2026 | Roy Morgan | 881 | 32.0 | 25.5 | 13.5 | 8.5 | 8.5 | 2.0 | 8.0 |
| 2–9 Jul 2026 | Reid Research | 1000 | 28.7 | 34.0 | 10.3 | 7.8 | 11.5 | 2.3 | 4.7 |
| 1–5 Jul 2026 | Curia | 1000 | 30.5 | 31.5 | 10.4 | 6.9 | 10.8 | 3.4 | 3.3 |
| 13–17 Jun 2026 | Verian | 1001 | 29.0 | 32.0 | 13.0 | 6.0 | 11.0 | 1.8 | 4.6 |
| 5–11 Jun 2026 | Freshwater Strategy | 1038 | 29.0 | 35.0 | 10.0 | 8.0 | 12.0 | 2.0 | – |
| 25 May – 21 Jun 2026 | Roy Morgan | 891 | 31.0 | 25.5 | 13.5 | 9.5 | 10.5 | 3.0 | 6.5 |
| 4–8 Jun 2026 | Curia | 1000 | 30.1 | 32.2 | 11.5 | 7.8 | 11.4 | 3.1 | 3.2 |
| 1–10 Jun 2026 | Talbot Mills | 1021 | 29.0 | 34.0 | 13.0 | 6.0 | 12.0 | 2.6 | 3.3 |
| 27 Apr – 24 May 2026 | Roy Morgan | 870 | 30.5 | 26.5 | 12.5 | 10.0 | 11.0 | 2.5 | 6.0 |
| 3–7 May 2026 | Curia | 1000 | 30.0 | 31.9 | 9.7 | 6.5 | 11.7 | 4.1 | 2.8 |
| 1–10 May 2026 | Talbot Mills | 1000 | 29.0 | 36.0 | 9.0 | 7.0 | 14.0 | 2.0 | – |
| 16 Apr 2026 | Talbot Mills | 1082 | 29.0 | 36.0 | 7.0 | 8.0 | 15.0 | 1.9 | 2.3 |
| 11–15 Apr 2026 | Verian | 1010 | 30.0 | 37.0 | 11.0 | 7.0 | 10.0 | 1.5 | 3.3 |
| 30 Mar – 26 Apr 2026 | Roy Morgan | 887 | 25.5 | 34.0 | 11.0 | 10.5 | 11.5 | 3.0 | 4.0 |
| 1–2 Apr 2026 | Curia | 1000 | 29.8 | 33.4 | 7.8 | 9.0 | 13.6 | 2.6 | 2.6 |
Data
The numbers behind this page, regenerated with every run. The columns are described in the outputs documentation.
- Forecast: summary.json · forecast.csv · seats.csv · coalitions.csv · trend.csv · house_effects.csv
- Charts: voting_intention620.svg · voting_intention375.svg · voting_intention_all620.svg · voting_intention_all375.svg · election_night620.svg · election_night375.svg · saturday620.svg · saturday375.svg
- Backtests: summary.csv · summary_by_horizon.csv · head_to_head.csv · scores.csv · stacking.json · probe_fundamentals.json
About the model
Weekly support for 7 parties and “Other” follows a correlated random walk, pinned to the official results of the 2011–2023 elections. Each poll is read through its pollster’s house effect and an industry-wide polling error. The 2026 election-day error cannot be seen yet, so it is drawn from past elections, with heavy tails and a wider spread for parties that are small or have never been elected. Variants are combined with weights from backtests, and seats follow the MMP rules. How the model works.
Model diagnostics: gauss (max R̂ 1.010, min ESS 565, divergences 0); heavy (max R̂ 1.007, min ESS 538, divergences 0).